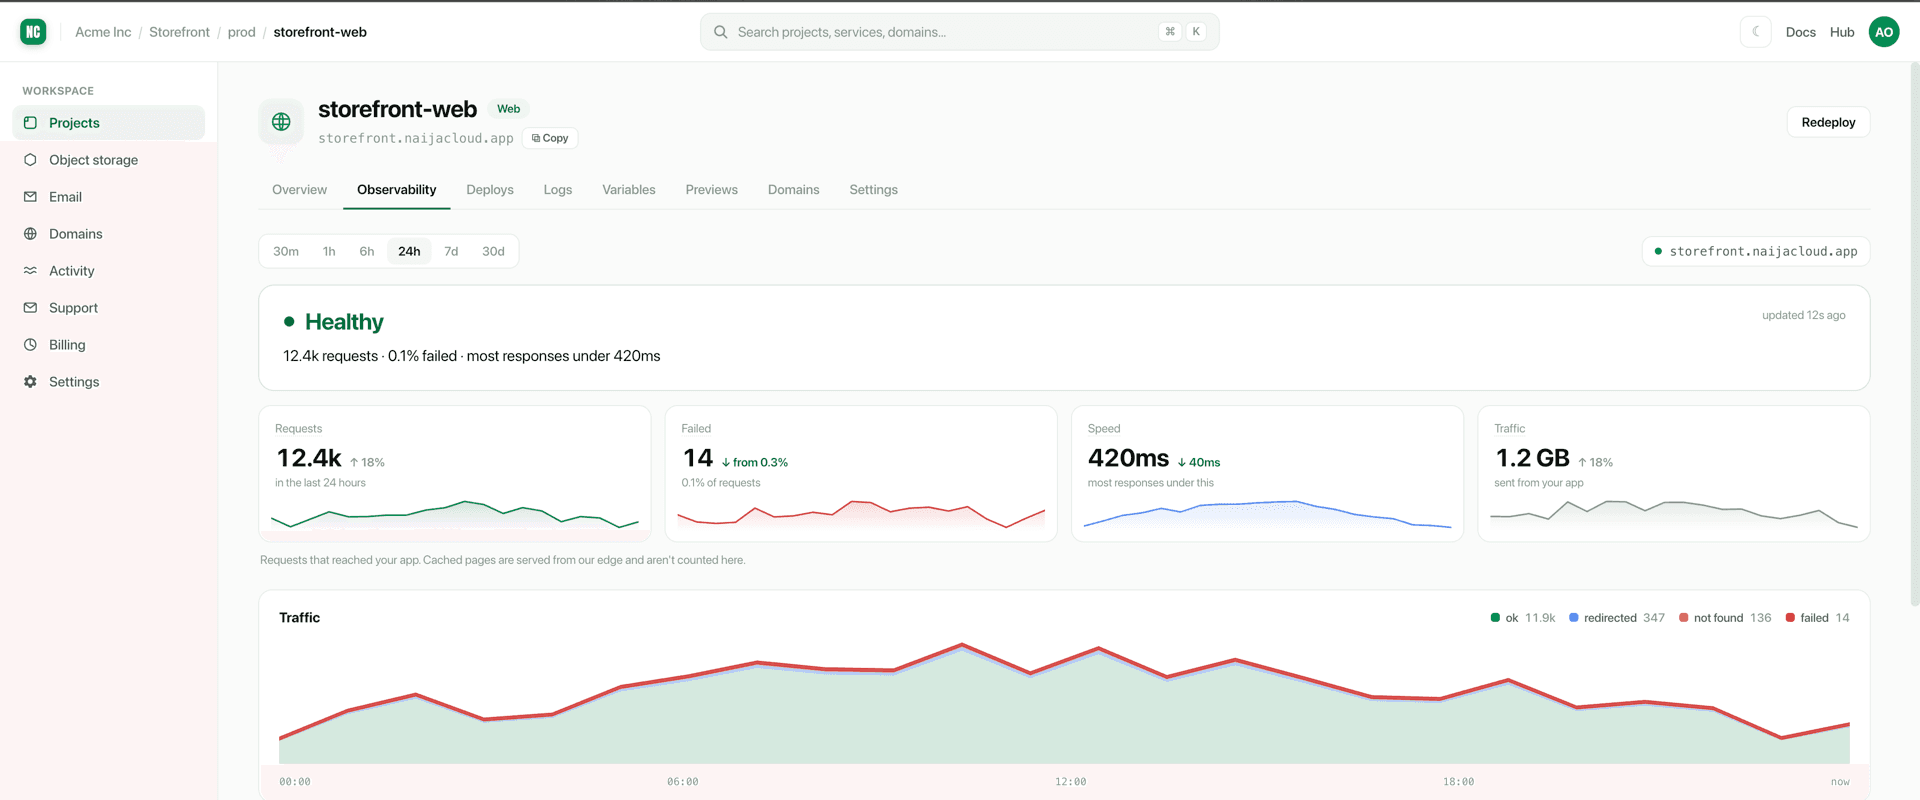
Most teams find out their app is broken the same way: a customer tells them. Usually on WhatsApp, usually with a screenshot, usually hours after it started.
Argus is how we stop finding out that way. It is our monitoring for every app: errors, logs, performance, uptime and cron checks, status pages and product analytics, in one place and in the same dashboard as your services. It opens today, and it is free to start.
What it does
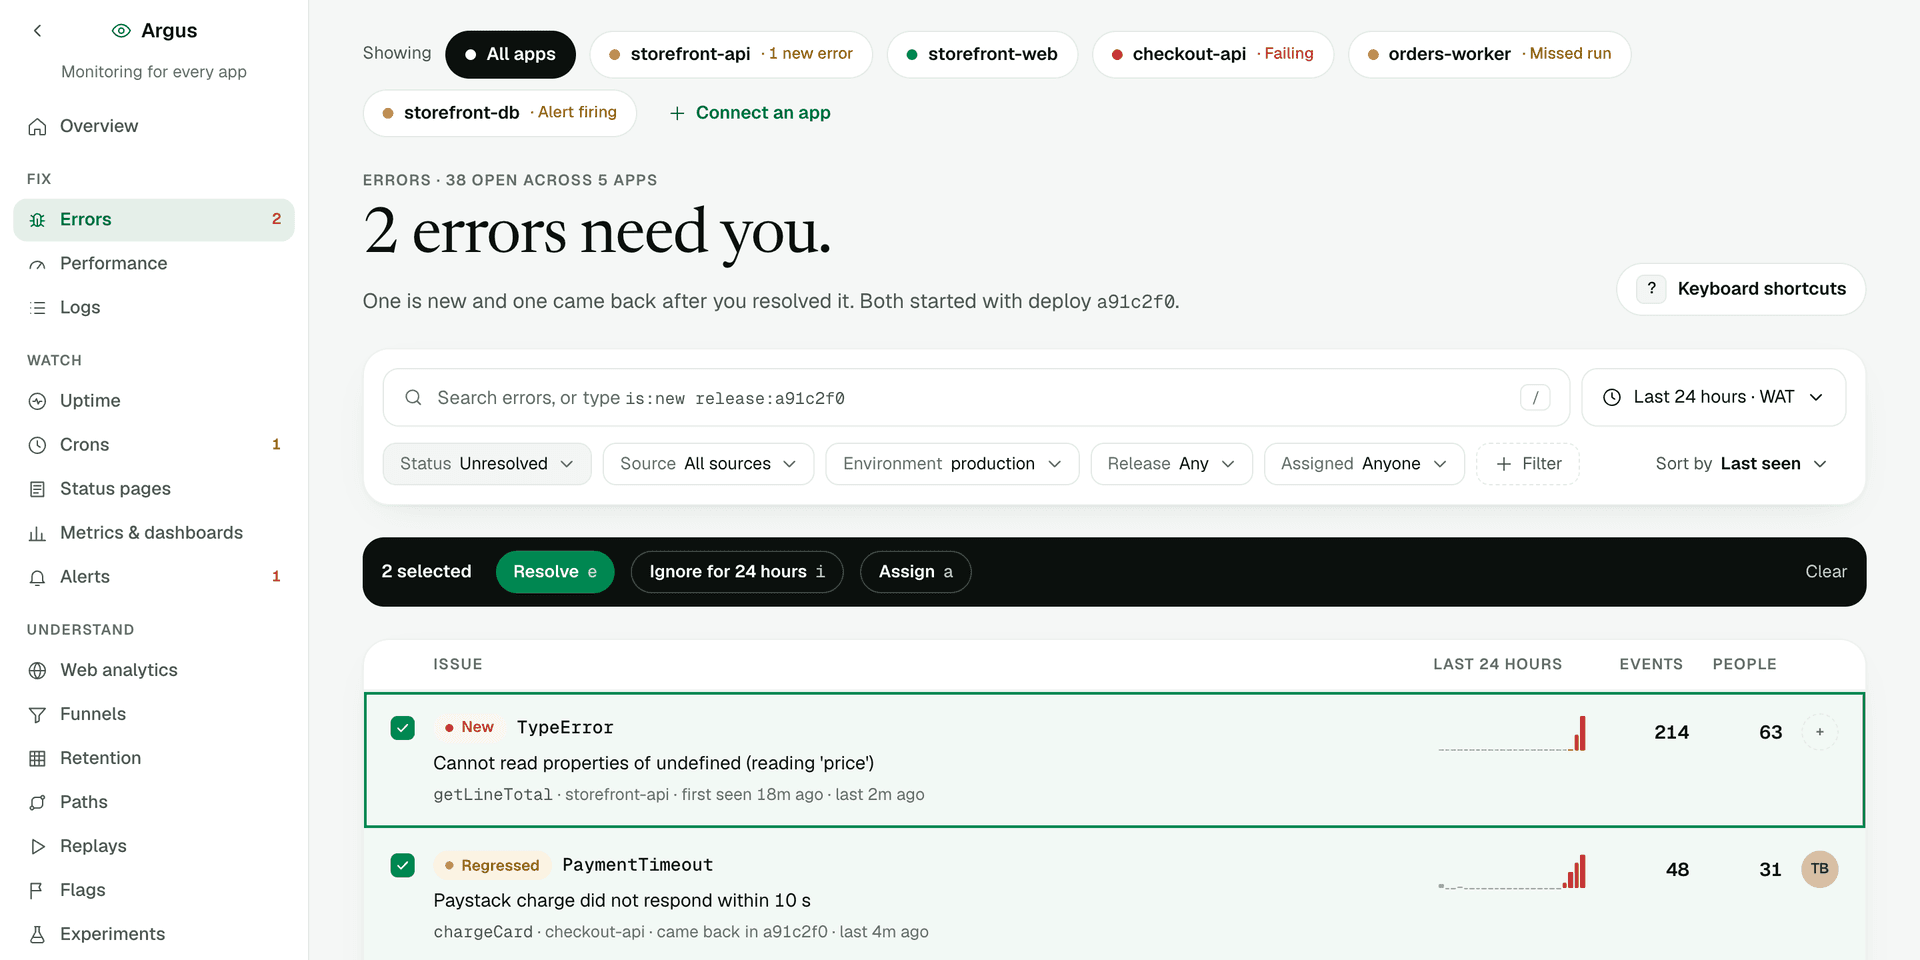
Errors, with their cause. Every crash is grouped into one issue with the line that threw it, how many people it hit, and the deploy that started it. "Started 12 minutes after you deployed a91c2f0" is a better first sentence than a stack trace.
Uptime and cron checks from Nigeria. Your users are here, so our checks start here, then run from Europe and the US. A check counts as down only when the locations agree, so one bad route somewhere doesn't wake you at 3am. A cron job pings a URL when it runs; if a run is missed or fails, you hear about it.
A status page for your customers, with incidents you post in plain words, on your own domain on the paid plans.
Logs, metrics and traces. Search logs in plain words and tail them live. Build dashboards, read Prometheus metrics, and find the slow endpoint or the N+1 query behind a slow page.
Analytics, replays and flags. Pages, funnels and where people drop off, without cookies. Session replays with every input masked. Feature flags and experiments to roll a change out gradually and see whether it helped.
How you hear about it
Alerts go by email, with nothing to set up. Every member of the workspace hears when an error is new, comes back after it was resolved or spikes, when a monitor goes down and comes back up, and when a cron run is missed. One incident sends one alert, not a storm, and an error emails at most once an hour.
To send alerts into your own tools, add a Slack channel or a webhook.
Webhooks are plain JSON over HTTPS, and with a signing secret every request
carries an X-Argus-Signature header, an HMAC-SHA256 of the timestamp and the
body, so your server can check it really came from us. If your endpoint is
down when an alert goes out, Argus tries again, and drops the retry if the
problem has already cleared. The alerts docs have the
body and the signature check.
Connecting your app
On Naijacloud, it is one switch. Open a web service or cron job and turn
Argus on. From the next deploy we set SENTRY_DSN, SENTRY_RELEASE and
SENTRY_ENVIRONMENT for you, so any Sentry SDK in your app reports to Argus
with no configuration, and every error knows which deploy it came from.
Your services already show requests and basic metrics for free, with nothing
to install.
Anywhere else, keep your code. Argus speaks the Sentry protocol and
OpenTelemetry. If you already use a Sentry SDK, point its DSN at Argus. For
traces, metrics and logs, send OpenTelemetry. We also publish our own SDKs:
@naijacloud/argus on npm, naijacloud-argus on PyPI and RubyGems,
naijacloud/argus and naijacloud/argus-laravel on Packagist, and
github.com/naijacloud/argus-go. You don't need to host anything with us to
use Argus.
Pricing, in naira
| Plan | Price | What's included |
|---|---|---|
| Free | ₦0 | 10,000 errors a month, 3 GB of logs kept 3 days, 10 uptime monitors checked every 5 minutes, 1 status page, 500 replays |
| Pro | ₦7,500 a month | 200,000 errors, 30 GB of logs kept 15 days, 50 monitors checked every minute, 5 status pages on your own domain, 10,000 replays |
| Scale | ₦60,000 a month | 2 million errors, 300 GB of logs kept 30 days, 300 monitors checked every 30 seconds, 100,000 replays |
Paid plans come out of your Naijacloud balance. No card, no dollar invoice, and the price doesn't move with the exchange rate. The full table is on the pricing page.
What we decided about your data
Passwords, card numbers, tokens and cookies are removed before anything is stored. We don't keep IP addresses unless you turn that on. Replays mask every input by default. Everything is stored on our own servers in Germany, in the EU, not with a third party.
We use it ourselves
Naijacloud's own control plane and dashboard report to Argus. When we have a bad day, Argus is how we see what happened, which deploy did it and who it touched, usually before anyone writes to support.
Where it is
Open Argus in your dashboard, or read what it does first. If you're not on Naijacloud yet, start free: no card, and no hosting needed.
Tell us what you want it to watch next. Reply to the launch email, or post in the Hub.